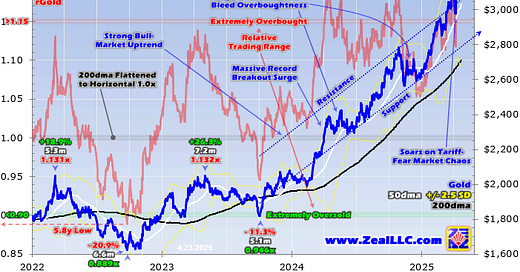
Gold just soared to crazy-overbought levels, among its most-extreme in modern history! Though still nowhere near shooting parabolic, such exceedingly-stretched technicals dramatically up the odds gold is due for a rebalancing selloff. That will likely be correction-grade, though precedent shows a quick bear is possible. Despite this probable cyclical-bull topping, gold’s relatively-small secular bull remains alive and well.
Gold is having a hell of a year, blasting 30.4% higher in 2025 as of this Monday! That outperformance is even more impressive compared to the S&P 500 and bitcoin being down 12.3% and 6.8% year-to-date in that same span. Gold has achieved 24 new record closes so far in 2025, and its big-and-fast gains are winning many converts. Speculators and investors alike have grown much-more-bullish on this leading asset.
Even more remarkable, gold’s recent advance is just part of an epic monster upleg. In the 18.5 months since early October 2023, gold has rocketed 88.0% higher! That’s a mighty cyclical bull which start at 20% gains, but incredibly also a single upleg suffering zero 10%+ corrections. As this seemed like one of gold’s strongest bull runs ever, I had to know how it stacked up to precedent which required some research.
Gold’s entire modern history extends back to 1971, as that August US president Richard Nixon severed the dollar’s gold standard. So I built a spreadsheet to analyze all daily gold data going back to January 1971, a 54.3-year span with 13,695 trading days. I wrote formulas to collate all 10%+ closing gold moves over that half-century-plus timeframe. The results were certainly interesting, illuminating today’s situation.
Moves were defined as uplegs if gold rallied between 10% to 20%, with cyclical bulls starting at that latter threshold. Corrections were 10%-to-20% selloffs, with anything bigger being cyclical bears. Gold has seen 83 total 10%+ moves since early 1971, 42 bulls or uplegs and 41 bears or corrections. In addition to their size and duration, I also looked at how overextended gold was when each 10%+ move climaxed.
Absolute price levels really don’t matter much in markets, far more important is how fast prices moved to get where they are. Gold averaged near $41 in 1971, when an upleg very similar to today’s powered way higher. It catapulted gold up 86.5% in 18.8 months, nearly identical to today’s 88.0% in 18.5 months! Yet in 2024 which hosted most of today’s monster, gold averaged $2,391. Moves’ speeds are way more relevant.
There are many ways to quantify how far and fast gold moves. After a quarter-century-plus of actively trading gold stocks and gold with much success, my favorite speed measure is a simple one. I call it Relative Gold or rGold, which simply divides gold’s closes by their trailing 200-day moving averages. 200dmas are ideal price baselines, gradually evolving to reflect changing gold levels rather than being static.
This rGold construct effectively flattens gold’s 200dma to horizontal and renders all prices in constant-percentage terms that are perfectly comparable over any timespans including decades. Charted over time, rGold tends to form horizontal trading ranges that are incredibly useful to game major toppings and bottomings. I’ve found defining rGold ranges using the last five calendar years of data very effective.
When gold surges too far too fast relative to its own precedent, it grows increasingly overbought. Around where such surges typically fail is the top of rGold’s trading range, where extreme overboughtness starts. That is running 1.15x+ now, when gold stretches more than 15% above its 200dma. Remarkably this monster gold upleg has already spent plenty of time in this rarefied territory while eluding any corrections!
ThisGold Relativitychart superimposes gold and its key technicals over rGold during these past several years or so. The rGold multiple is rendered in red, revealing the constant-percentage distance gold has advanced above its 200dma. Gold already soared into extreme overboughtness in both mid-April 2024 and late October 2024 with little consequence. But its latest foray is next-level extraordinarily-overbought!
CONTINUED…
READ THE ADAM HAMILTON ARTICLE HERE!
Feel free to share with friends and colleagues!


Note that Hamilton is talking about fake Comex paper gold and not real physical gold. Institutions that buy "gold" will go long Comex contracts and GLD. GLD is a derivative of gold too in that it indexes the price of gold but there's not any bona fide accountability of the gold that is held by the Trust. With Comex contracts. That said the banks still have the ability to somewhat control the directional movement of the price using contracts. On the other hand, overbought/oversold and RSI/MACD does not apply to physical gold (stated emphatically). The only "technical" condition of gold is that it is extremely under-owned relative to pre-1980's levels, when institutions held over 5% of their assets in gold, and Bretton Woods, when the Central Bank standard was 40% of reserves. I think Russia has 20% in gold, at least based the holdings it discloses. We don't know China's (the PBoC) actual amount of gold held.
We shall see if its different this time. Things are not normal behind the wizard’s curtain.