JORDAN ROY-BYRNE: The 1960s-1970s period is a far better comparison for Gold & Silver than the 2000s. Here's why....
Thread…
1) Secular Bear Market in Bonds
This is the major difference that few recognize.
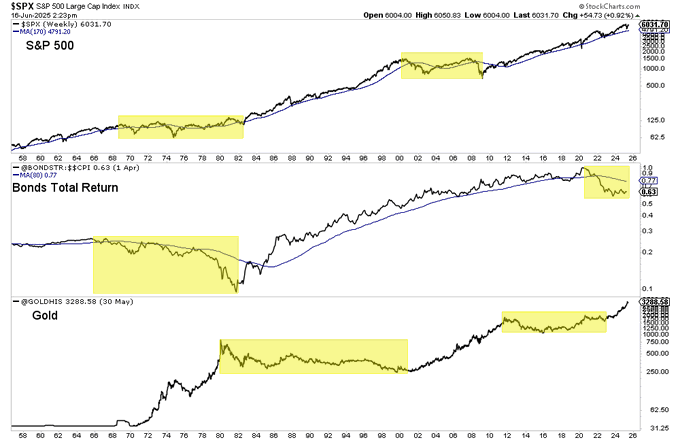
From 1920 through 2020, a 100-year period, the only time you lost money in Bonds was from 1965 to 1982.
The yellow in the chart highlights secular bear markets.
The 80-month moving average of the real total return in bonds is an excellent secular trend indicator.
While for stocks, the 40-month moving average is the secular trend indicator.
When Bonds break, capital moves into Gold and hard assets but also stocks.
Eventually the secular bond bear will push stocks into a secular bear market. That means the two major asset classes will be in a secular bear.
2) New All-Time High in Gold, Early in Bull
Gold spent the majority of the 2001 to 2011 period below all-time highs.
It wasn't until the end of 2007 when it first made its new all-time high. That only lasted for ~8 months.
After the GFC, Gold would spend its last 2 years at new all-time highs.
Contrast that with the 1970s and 2020s.
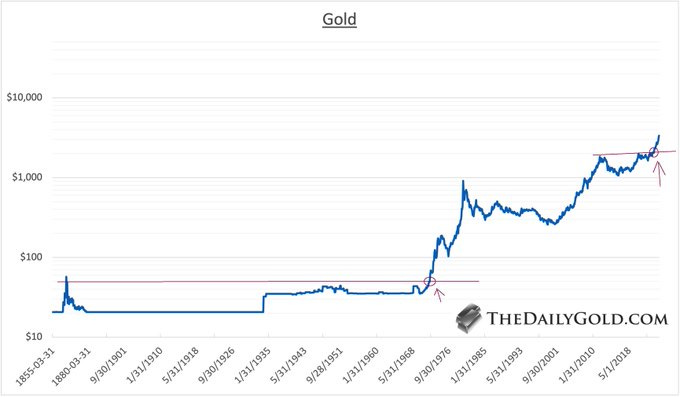
Gold's bull market began in the early 1970s with the Greatest Breakout of All-Time. It ran for another 8 years.
Gold's new secular bull market began at the end of 2023 with the move to breaking out of its 13-year-long cup and handle pattern.
This is when Gold's new secular bull market began in real terms. Not in 2016 or 2018. Numerous other data points support this view.
CONTINUED…
READ THE JORDAN ROY-BYRNE X POST HERE!
Feel free to share with friends and colleagues!


